
Download
Original Article
Comparison of the composition and functional properties of red and purple intermediate wheatgrass (Thinopyrum intermedium) varieties
Buket Cetiner1, Zeynep H. Tekin-Cakmak2, Vladimir P. Shamanin3, Merve Tomas4, Inna V. Pototskaya3, Filiz Koksel5,6,7, Sergey S. Shepelev3, Kubra Ozkan2, Oguz Acar1, Alexey I. Morgounov3, Osman Sagdic2, Hamit Koksel3,8*
1Department of Quality and Technology, Field Crops Central Research Institute, Ankara, Türkiye;
2Department of Food Engineering, Faculty of Chemical and Metallurgical Engineering, Davutpasa Campus, Yildiz Technical University, Istanbul, Türkiye;
3Omsk State Agrarian University, 1 Institutskaya pl ., Omsk, Russia;
4Department of Food Engineering, Faculty of Chemical and Metallurgical Engineering, Istanbul Technical University, Maslak, Istanbul, Türkiye;
5Department of Food and Human Nutritional Sciences, Faculty of Agricultural and Food Sciences, University of Manitoba, Winnipeg, Manitoba, Canada;
6Richardson Centre for Food Technology and Research, University of Manitoba, Winnipeg, Manitoba, Canada;
7Department of Chemistry, Faculty of Engineering and Natural Sciences, Istinye University, Istanbul, Türkiye;
8Department of Gastronomy and Culinary Arts, Faculty of Fine Arts, Design and Architecture, Istinye University, Istanbul, Türkiye
Abstract
Intermediate wheatgrass (IWG; Thinopyrum intermedium) is a promising perennial crop with potential -nutritional and functional benefits. Physical (thousand kernel weight, color), chemical (protein content, mineral composition) and functional (phenolic contents, antioxidant capacity, phenolic acids, anthocyanins, lutein, zeaxanthin, and β-carotene contents) grain characteristics of two IWG varieties, namely, Sova and Filin, were investigated. Protein contents of Sova (red) and Filin (purple) grains were 20.2 and 21.3%, respectively. The Mg, Ca, Mn, Fe, Cu, and Zn contents of Sova were 1575, 1259, 53.3, 51.5, 4.9, and 27.7 mg•kg–1, respectively, and those of Filin were 1560, 1542, 55.7, 59.3, 5.9, and 33.1 mg•kg–1, respectively. Zn:Cu ratios (5.65 for Sova and 5.61 for Filin) were balanced, minimizing risk of Cu deficiency. In both IWG varieties, phenolic contents in the bound fraction and their antioxidant activities (ABTS and CUPRAC) were higher than those in free fraction. Ferulic acid was the most abundant phenolic acid found in the bound fraction of IWG. These findings highlight the nutritional and functional potential of these two IWG varieties, reinforcing their value as promising ingredients for developing health-oriented, sustainable grain-based food products.
Key words: Perennial wheat, Mineral, Mineral ratio, Phenolics, Antioxidant activity, Anthocyanins
*Corresponding Author: Hamit Koksel, Omsk State Agrarian University, 1 Institutskaya pl., Omsk 644008, Russia; Department of Gastronomy and Culinary Arts, Faculty of Fine Arts, Design and Architecture, Istinye University, 34396, Istanbul, Türkiye. Email: hamit.koksel@istinye.edu.tr
Academic Editor: Teresa D’Amore, PhD, Department of Food Safety, Nutrition and Veterinary Public Health, Italian National Institute of Health—Istituto Superiore di Sanità (ISS), Rome, Italy
Received: 23 October 2025; Accepted: 31 March 2026; Published: 14 May 2026
© 2026 Codon Publications
This is an Open Access article distributed under the terms of the Creative Commons Attribution-NonCommercial-ShareAlike 4.0 International (CC BY-NC-SA 4.0). License (http://creativecommons.org/licenses/by-nc-sa/4.0/)
Introduction
Perennial grains offer a promising pathway toward ecological intensification by enabling the direct production of human-edible crops without the need for annual soil disturbance and replanting (Dehaan et al., 2023). Thinopyrum intermedium is a perennial crop that is commonly known as intermediate wheatgrass (IWG). IWG has gained attention for its potential as a food crop due to its nutritional benefits (Cetiner et al., 2025). In addition, IWG is being explored as a sustainable alternative to annual wheats due to its deep roots, which can help prevent soil erosion and sequester carbon (Crews & Cattani, 2018; Cui et al., 2018; Dehaan et al., 2023; Pimentel et al., 2012; Tang et al., 2024; Taylor et al., 2023).
More than two decades have passed since the first study describing the food-relevant characteristics of IWG was published (Becker et al., 1991). However, research on the chemical composition and functionality of IWG is still quite limited. Given its distinct nutritional profile, for example, higher levels of protein, insoluble dietary fiber, fat, and ash, and less starch, compared to wheat (Becker et al., 1991; Marti et al., 2015), IWG holds untapped potential as a functional ingredient to enhance the nutritional quality of a diverse range of food products and address growing consumer demand for healthier, sustainable grain options.
Due to their widespread consumption, cereals represent a major dietary source of plant phenolics, contributing significantly to the overall intake of these bioactive compounds. Phenolic acids are the most widespread type of phenolics in cereals (Li et al., 2008). They are present in cereal cell walls as covalently bound components, occurring both in esterified form (e.g., linked to arabinoxylans) and as etherified structures associated with lignin. Through covalent ester and ether linkages, these compounds facilitate interactions between polysaccharides and other cell wall constituents, particularly lignin (Naczk and Shahidi, 2004). In addition, they promote interconnections among polysaccharide chains, contributing to cell wall rigidity and integrity (Brett and Waldron, 1996). Among these phenolic acids, ferulic acid–derived structures have been documented for several decades in cereal by-products such as wheat bran (Lempereur et al., 1997; Lequart et al., 1999). Ferulic acid predominantly occurs as ester-linked moieties attached to the arabinose side chains of cell-wall arabinoxylans and is especially abundant in the aleurone layer, pericarp, and embryo tissues (Parker et al., 2005). Given that both ester and ether bonds are covalent in nature, these phenolic compounds are regarded as chemically bound components of the cell wall rather than freely extractable molecules.
IWG contains not only higher levels of phenolic compounds but also greater concentrations of zeaxanthin, lutein, and ferulic acid, along with enhanced antioxidant activity (AA) compared to wheat (Craine & DeHaan, 2024; Tyl and Ismail, 2019). These attributes position IWG as a promising cereal for enhancing the phenolic content and antioxidant capacity of grain-based diets, offering added nutritional and functional value compared to conventional cereals like wheat.
Colored grains provide an innovative approach for augmenting the nutritional quality of grain flours, notably through their elevated levels of antioxidants, including polyphenols such as flavonoids, phenolic, acids and specifically anthocyanins (Padhy et al., 2024; Shamanin et al., 2024). For example, the purple coloration of cereal grains results from the accumulation of anthocyanins in the pericarp (Dangi et al., 2023).
Cereals provide a rich source of essential minerals, which are crucial for a healthy life. Nutrient supplements cannot completely substitute the nutrients found in natural foods for a balanced diet, and consuming a diverse range of nutrient-rich foods is the most effective way to support health and prevent chronic diseases (Quintaes & Diez-Garcia, 2015). Minerals are divided into microelements (required in smaller amounts) and macroelements (necessary in greater quantities) (Martínez-Ballesta et al., 2010). Phosphorus, sodium, calcium, potassium, chloride, sulfur, and magnesium are macroelements, while copper, iodine, manganese, iron, molybdenum, zinc, cobalt, and selenium are microelements (Hussain et al., 2010). Imbalances or deficiencies in essential minerals can lead to various health problems (Biel et al., 2021; Rietra et al., 2017; Whittaker, 1998). A balanced diet requires not only adequate quantities of minerals but also appropriate ratios among them (Biel et al., 2021). For example, insufficient magnesium intake, combined with high calcium intake and elevated calcium to magnesium (Ca:Mg) ratios, have been linked to a heightened risk of cardiovascular diseases, metabolic syndrome, inflammation, and cancers such as colorectal, prostate, and esophageal, as well as increased overall mortality (Costello et al., 2021; DeLuccia et al., 2019). By combining health-promoting nutritional attributes with ecological resilience, IWG stands out as a promising ingredient for next-generation cereal products aligned with global sustainability, nutrition, and regenerative agriculture goals (Bharathi et al., 2022; Cetiner et al., 2025; Oliveira et al., 2024).
The hypothesis of this study was that Sova (red) and Filin (purple) varieties of IWG exhibit significant differences in their physical, nutritional, and functional properties, which may influence their nutritional value and potential applications in health-oriented grain-based foods. To the best of our knowledge, studies specifically focusing on purple-colored IWG varieties are not available in the literature. To build on the growing interest in IWG as a nutritionally and environmentally promising cereal, this study aimed to characterize two IWG varieties—one red and one purple—with respect to their grain quality and potential health benefits. Specifically, the objectives of this study were to (1) assess their physical characteristics (thousand kernel weight (TKW) and color) and protein content; (2) analyze their mineral composition and evaluate key mineral ratios relevant to human nutrition; and (3) examine the free, bound, and total phenolic contents, antioxidant capacities, individual phenolic acids, anthocyanins, and carotenoids (zeaxanthin, lutein and β-carotene). These analyses will provide insights into the potential of these IWG varieties to contribute to the development of functional and nutrient-rich grain-based foods.
Materials and Methods
Materials
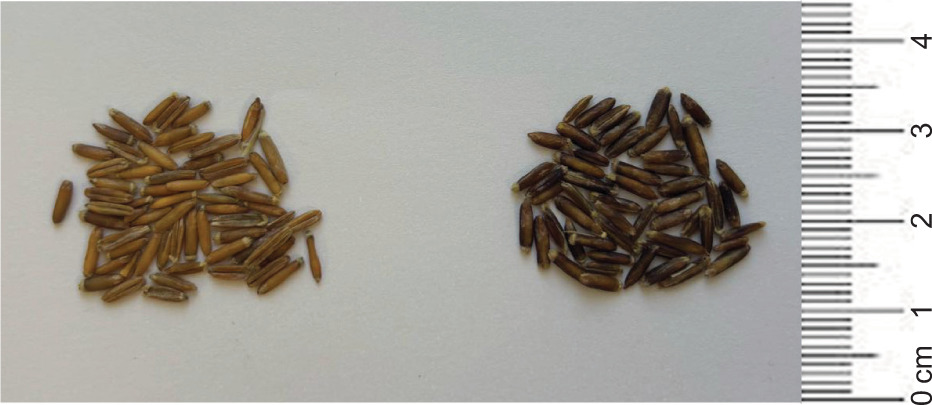
Two IWG varieties, cv. Sova and cv. Filin, were -studied. Digital images of the kernels of Sova (left) and Filin (right) are presented in Figure 1. The variety Sova which was officially released for cultivation in Russia in 2020 was developed at the Omsk State Agrarian University by mass-selection of overwintered biotypes from the population of wheatgrasses obtained from the Land Institute (Saline, KS, USA). This selection was followed by directed pollination and creation of a new winter-hardy synthetic population (Shamanin et al., 2021). Sova’s grain yield, green biomass, and hay have increased every year for 3 years after sowing, with an average grain yield of 0.92 t/ha, varying from 0.83 in 2017 to 1.04 t/ha in 2019 (Ajdarov et al., 2021). Filin was selected from Sova based on the grain color of individual plants. Selected purple color–grained plants were mixed to establish a new population which was subjected to pollination and selection under local Omsk conditions. Grain samples were harvested from a field trial at Omsk and obtained from a single growing season under standard cultivation practices. After harvest, they were ground for 90 s using a laboratory grinder (CemotecTM, CM290, Denmark).
Figure 1. Digital images of the kernels of Sova (left) and Filin (right).
Chemicals
Acetone, ethyl acetate, hexane, diethyl ether, 1,1--diphenyl-2-picryl-hydrazil (DPPH), and Folin–Ciocalteu reagent were acquired from Sigma-Aldrich (Bornem, Belgium). Gallic acid was purchased from ICN Biomedicals, Inc. (Aurora, OH, USA). Analytical grade methanol, absolute ethyl alcohol, copper (II) chloride, glacial acetic acid, and ammonium acetate were purchased from Merck (Darmstadt, Germany).
Methods
Determination of IWG Grain Quality Parameters
Protein content (N × 6.25) was measured using combustion nitrogen analysis (Leco FP828, St. Joseph, MI, USA), which was calibrated with EDTA following the AACC International Method 46-30 (AACC International, 2010).
TKW was determined using a kernel counter (Delta TP04, Türkiye) in accordance with the ISO Method 520 (ISO 520, 2010).
The color values (L*, a*, b*) of IWG samples, under D65 illuminant and 10° observer conditions, were determined using a Miniscan spectrophotometer (HunterLab, Reston, VA, USA) following ASTM E 1164 (2002).
Determination of IWG bioactive compounds
Before extraction of any bioactive compounds, the IWG samples were defatted using the procedure outlined in Shamanin et al. (2022). The extraction of the free and bound phenolic compounds from the IWG samples followed the procedure described in Shamanin et al. (2022). The IWG extracts were kept at −18°C in amber-colored vials for future analysis.
The free and bound phenolic compounds of the IWG samples were measured according to Shamanin et al. (2022). The calibration curve for gallic acid was employed to determine the contents of free and bound phenolic compounds, which were then represented as gallic acid equivalents (GAE) in mg GAE/100 g. The total phenolic content was then calculated as the sum of these values and expressed as GAE in mg GAE/100 g d.b.
The DPPH radical scavenging activity, CUPRAC reducing assay, and ABTS radical cation scavenging capacity of the IWG samples were measured following Shamanin et al. (2023). The DPPH results are reported as % AA. The CUPRAC and ABTS results are expressed as mg Trolox equivalent (TE) /100 g d.b.
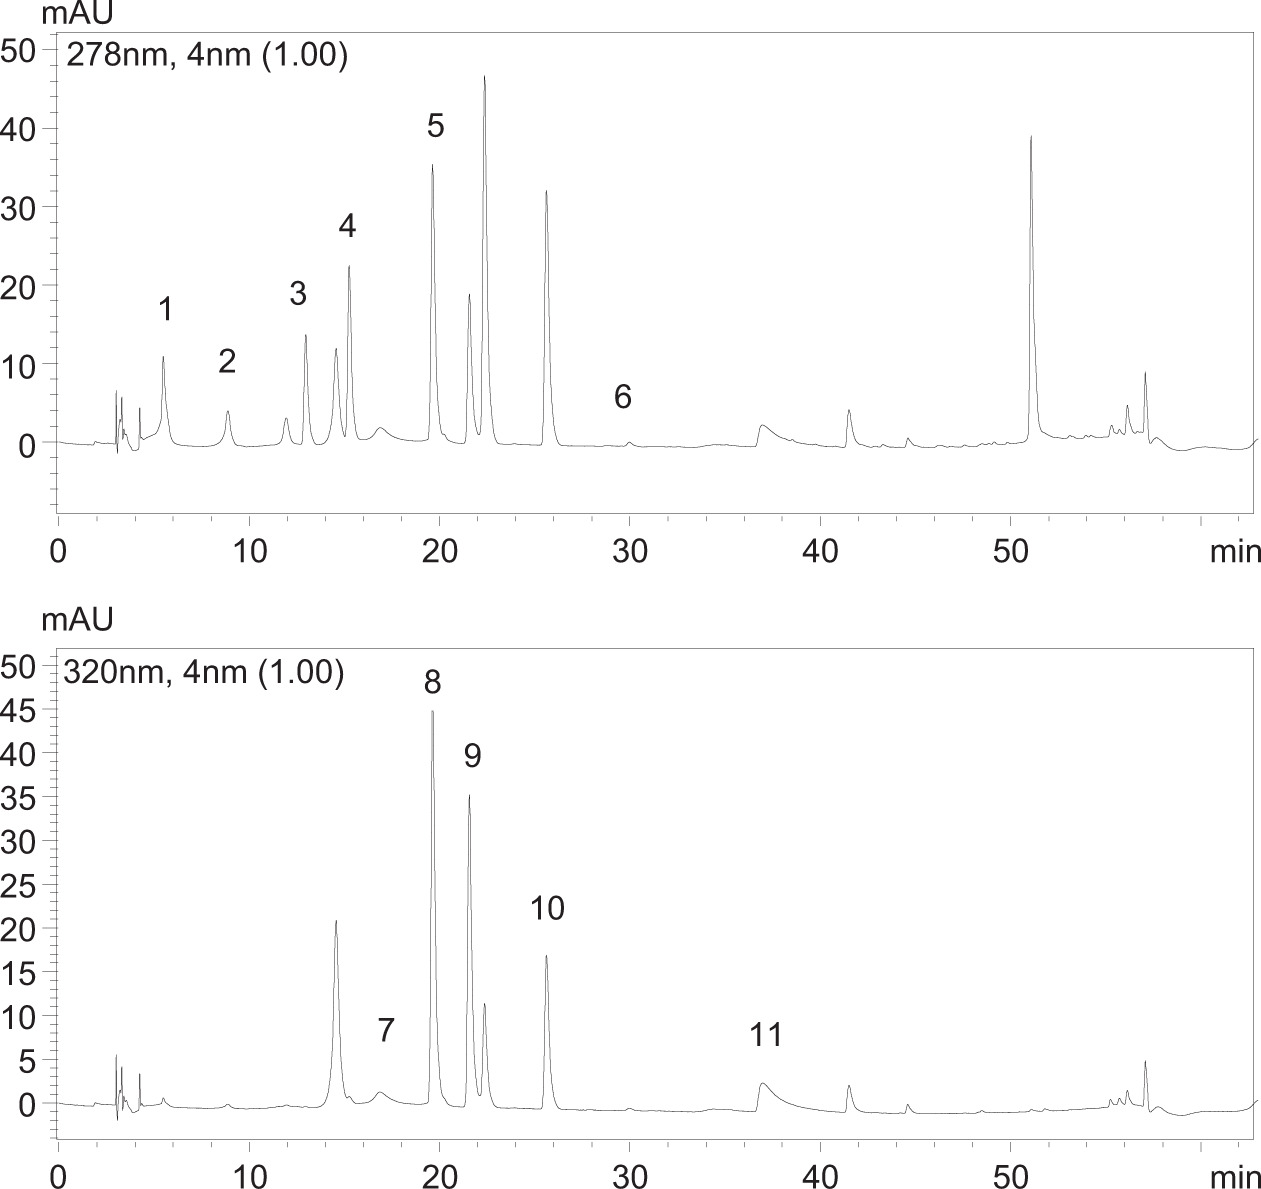
Individual phenolic acids in IWG extracts were identified using the method described by Shamanin et al. (2022), employing an HPLC system (Shimadzu, Japan) equipped with a diode array detector (DAD). The absorbances were recorded at 278, 320, and 360 nm. Chromatograms of the individual phenolic compounds are presented in Figure S1.
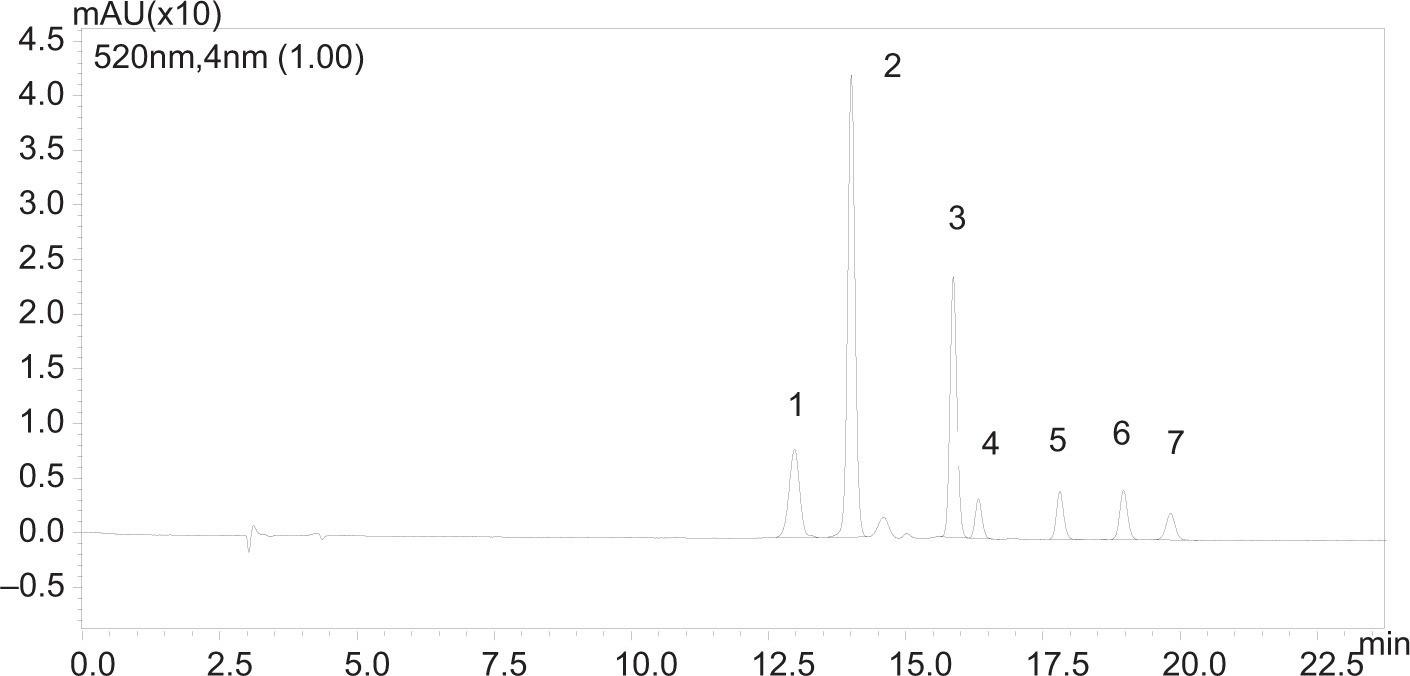
Identification of individual anthocyanins in IWG extracts was performed according to the method outlined by Shamanin et al. (2024) using an HPLC system (Shimadzu Corp., Kyoto, Japan). A total of seven standards were employed to achieve accurate separation and quantification of anthocyanins: Delphinidin-3-O-β-D-glucoside chloride, cyanidin 3-O-glucoside chloride, peonidin 3-O-glucoside chloride, malvidin-3-O-glucoside chloride, cyanidin-3,5-di-O-glucoside, pelargonidin-3-O-glucoside chloride, and cyanidin 3-O-rutinoside chloride (Figure S2). The individual anthocyanin contents in free and bound fractions of IWG samples are reported in μg/100 g d.b.
Carotenoid contents of IWG grains
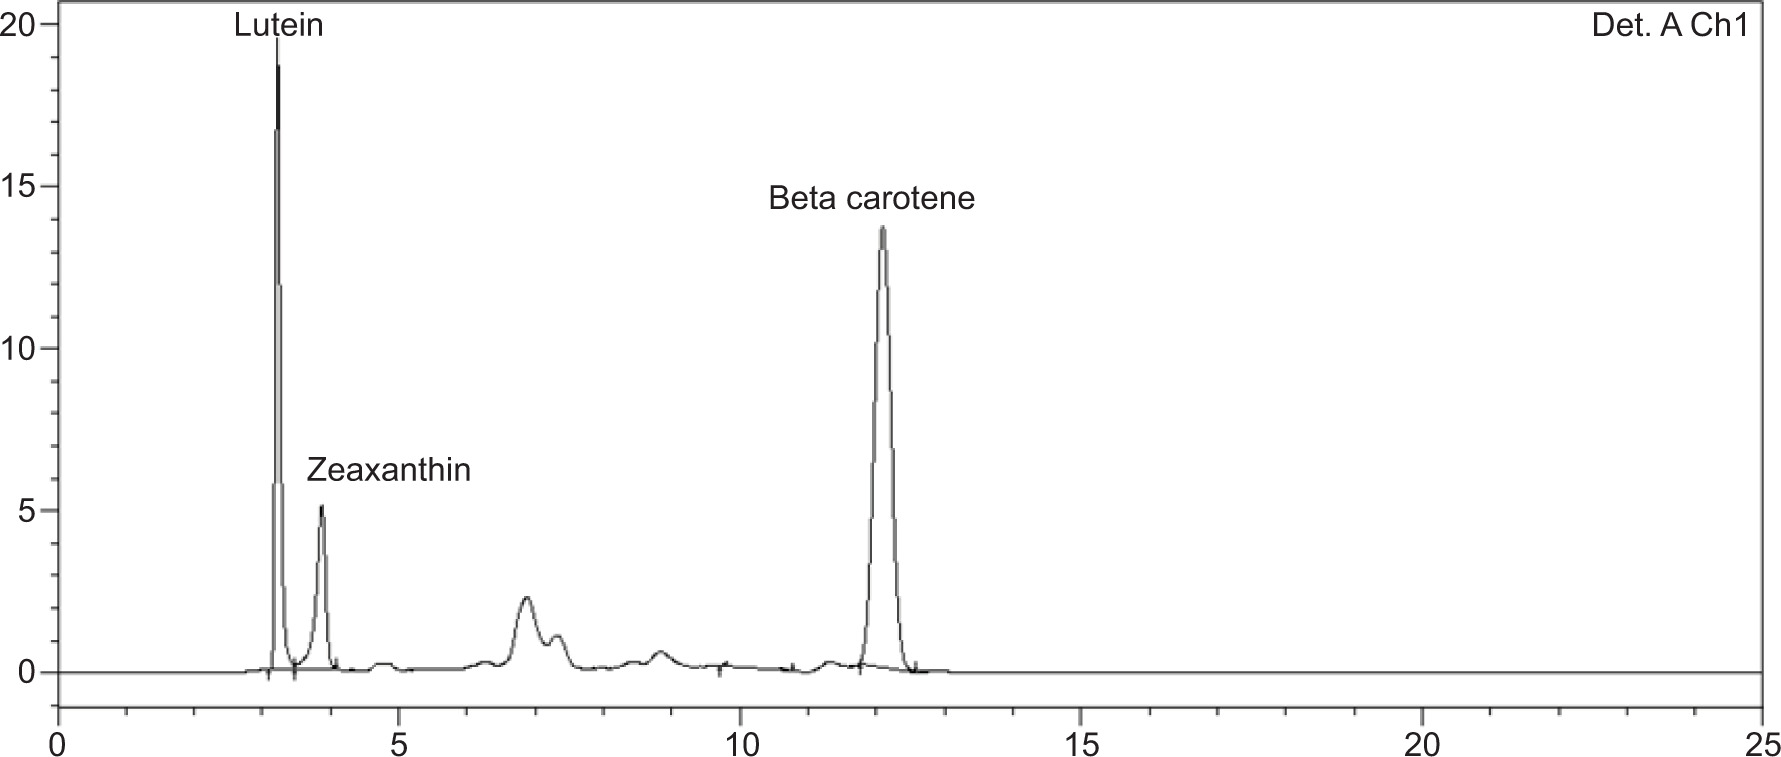
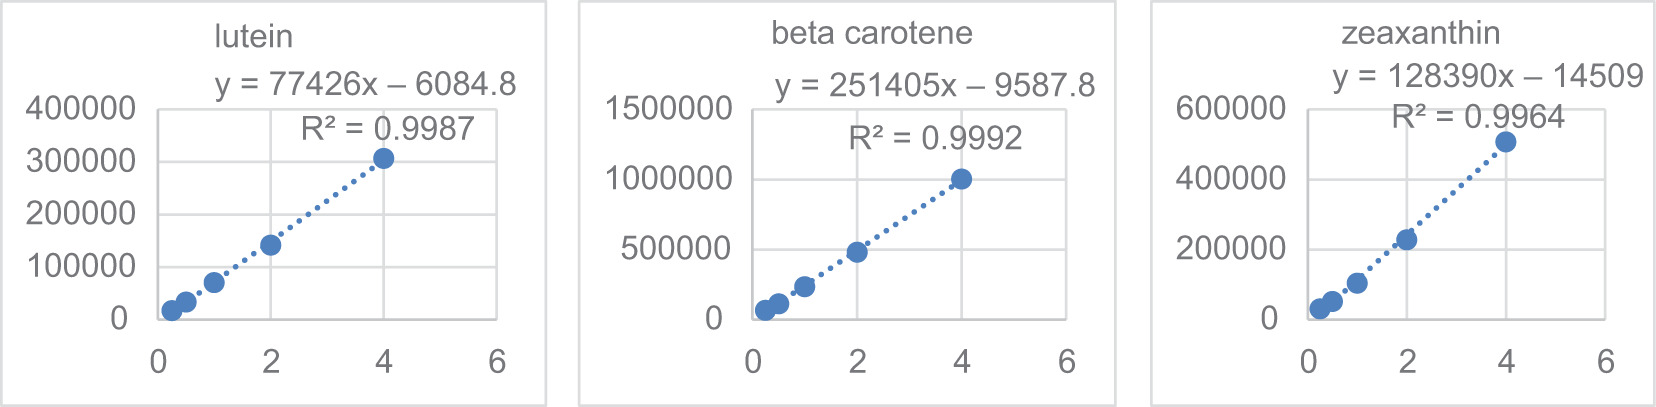
Lutein, zeaxanthin, and β-carotene were extracted with an organic solvent (1 mL) that contained hexane/acetone/ethanol (50:25:25 v/v/v) following the methods described by Nemli et al. (2021) with slight modifications. The mixtures were thereafter agitated vigorously and centrifuged at 4000 rpm for 1 minute at 40°C (Himac CR22N, Hitachi Koki, Japan), after which the supernatants were collected. Supernatents obtained were evaporated under a nitrogen gas flow until completely dry. The dry extracts were subsequently dissolved by addition of 2 mL of a THF-methanol (50:50 v/v) mixture. The resultant solutions were further filtered using 0.45 μm PTFE filters to eliminate any big particles and prepare them for injection into the HPLC apparatus (Shimadzu Corp., Kyoto, Japan). The carotenoids were separated and quantified during HPLC analysis using a reversed-phase column (Zorbax C8, 5 μm, 4.6 × 250 mm, PN 880,952–706) and UV–visible detector. The mobile phase was utilized as methanol:acetonitrile (90:10; v/v). All chromatograms were recorded at 475 nm. Identification and quantifications of zeaxanthin, lutein, and β-carotene were done by retention periods and standard curves. Chromatograms of the carotenoids and calibration curves of the standards are presented in Figure S3 and S4, respectively. Results are reported as μg/g sample.
Mineral composition of IWG grains
Samples were digested with HNO3 (5 mL; 65%) and H2O2 (2 mL; 30%) in a Mars 6 microwave system (CEM Corp., Matthews, NC, USA). After digestion, ultrapure water (Milli-Q Ultrapure Water System, Merck Millipore, Massachusetts, USA) was used to complete the total volume to 20 mL. Digestates were kept in a refrigerator (+4°C) until further analysis. The mineral content of digestates were determined by inductively coupled plasma mass spectrometry (ICP-MS; Agilent 7850, Agilent Technologies, Wilmington, DE, USA) according to the Agilent ICP-MS (7850/7800/7900) MassHunter Workstation User Guide (2022). Results were reported as mg•kg-1. Method accuracy was verified using an appropriate certified reference material (CRM) analyzed under the same experimental conditions. The method’s performance was evaluated using recovery and relative standard deviation (RSD) values (Table S2).
Statistical analysis
All experiments were performed at least in duplicate. Statistical analyses were performed using JMP software (Version 13.2.1, SAS Institute Inc., 2016, Cary, NC, USA). For comparisons between two groups, the t-test was used. After analysis of variance (ANOVA), if differences were significant (p<0.05), the LSD test was used for comparing three or more groups. Since the analyses were based on technical replicates obtained under identical experimental conditions, the statistical evaluation reflects analytical variability rather than biological variation. Therefore, the results should be interpreted as indicative of compositional differences between genotypes under the studied conditions.
Results and Discussion
Grain characteristics
Grain properties (thousand kernel weight; L*, a*, b* color values; and protein content) of IWG samples are presented in Table 1. Overall, compared to bread wheats, IWG kernels have thinner grains with lower bulk density (Banjade et al., 2019). In line with the literature, thousand kernel weights of Sova and Filin were 10.23 and 11.98 g, respectively, while that of bread wheats have been reported in the range of 27.8–39.8 g (Cetiner et al., 2020).
Table 1. Grain properties of IWG.
| Properties | Sova | Filin | |
|---|---|---|---|
| 1000 Kernel Weight (g, d.b.) | 10.23 ± 0.01b | 11.98 ± 0.09a | |
| Color | L* | 52.25 ± 0.42a | 39.45 ± 0.01b |
| a* | 10.60 ± 0.37a | 6.36 ± 0.04b | |
| b* | 25.08 ± 3.80a | 11.58 ± 0.23b | |
| Protein content (%, d.b.) | 20.2 ± 0.08a | 21.3 ± 0.39a | |
Values followed by different letters in the same row are significantly different (p<0.05). d.b.: dry basis.
Protein contents of Sova and Filin were 20.2 and 21.3% d.b., respectively, in line with the range reported by Bharathi et al. (2022) (17.6–23.5% d.b.) and Zhang et al. (2015) (16.4–23.6%). Compared to common wheat, IWG grain and flour have been reported to contain higher protein content (Cetiner et al., 2023b; Gazza et al., 2016; Marti et al., 2016; Rahardjo et al., 2018), in parallel with the findings of the present study. According to Pototskaya et al. (2022), IWG kernels are quite long and narrow, and therefore they have a relatively low endosperm proportion and a high bran-to-endosperm ratio. This contributes to their lower starch content and consequently higher protein concentration compared to common wheat.
The color of wheat grain is primarily localized in the bran layers. The red color results from the presence of major catechin-tannins and minor anthocyanins in the seed coat (testa), while the purple color is attributed to anthocyanins in the pericarp layer (Garg et al., 2016). Color L* (lightness), a* (redness/greenness), and b* (yellowness/blueness) values of IWG grains are presented in Table 1. The L*, a*, b* color values of Sova and Filin were 52.25, 10.60, 25.08 and 39.45, 6.36, 11.58, respectively. Filin exhibited lower L*, a* and b* values compared to Sova. The red color of Sova and the purple color of Filin grains can be linked to these differences; specifically, Filin’s lower a* and b* values, combined with its darker appearance (lower L*), contribute to its purplish hue. Such differences may arise from genotypic variations affecting pigment content or grain composition. Given that color is an important quality attribute influencing consumer perception, these variations may have implications for end-product quality and acceptance, depending on the product type and target market. Significant differences between the color of IWG flour and common wheat flour have also been reported (Cetiner et al., 2023b; Ferguson et al., 2024), where the b* color value of IWG grain was higher. The b* color value of IWG grain may differ among varieties, depending on the grain coat color (Cetiner et al., 2023b).
Grain mineral compositions and mineral ratios
Mineral compounds play a crucial role in human nutrition. Mineral contents of Sova and Filin are presented in Table 2. When the two IWG varieties are compared, Sova had relatively higher Mg (1575 mg•kg–1) content while Filin had higher Ca (1542 mg•kg–1), Mn (55.7 mg•kg–1), Fe (59.3) mg•kg–1, Cu (5.9 mg•kg–1), and Zn (33.1 mg•kg–1) contents (p<0.05).
Table 2. Grain mineral contents and mineral ratios of Sova and Filin.
| Sample | Mineral contents (mg•kg-1) | Mineral ratios | |||||||
|---|---|---|---|---|---|---|---|---|---|
| Mg | Ca | Mn | Fe | Cu | Zn | Ca:Mg | Fe:Zn | Zn:Cu | |
| Sova | 1575 ± 8.8a | 1259 ± 36.7b | 53.3 ± 0.41b | 51.5 ± 0.40b | 4.9 ± 0.02b | 27.7 ± 0.13b | 0.80 | 1.86 | 5.65 |
| Filin | 1560 ± 5.0b | 1542 ± 6.1a | 55.7 ± 0.32a | 59.3 ± 0.90a | 5.9 ± 0.06a | 33.1 ± 0.04a | 0.99 | 1.79 | 5.61 |
Values followed by different letters in the same column are significantly different (p<0.05).
Mineral composition of cereal grains is strongly influenced by both genetic and environmental factors, including soil mineral availability, agronomic practices, and climate (Del Coco et al., 2019). Despite this variability, IWG generally exhibits higher mineral contents compared to bread wheat. For example, Cetiner et al. (2023a) reported Ca, Cu, Fe, Mg, Mn, and Zn contents in bread wheat varieties in the range of 287.3–1248, 3.47–5.68, 29.39–44.48, 1078–1531, 33.02–52.45, and 11.44–33.59 mg•kg-1, respectively—values that are generally lower compared to those observed for Sova and Filin. It is well established in the literature that genotype-dependent differences in mineral uptake, translocation, and deposition in grains result in substantial mineral content variation among cultivars. Similarly, Zhao et al. (2009) reported Fe, Zn, and Se concentrations of 28.8–50.8 ppm, 13.5–34.5 ppm, and 32.9–237.9 ppb, respectively, in 150 bread wheat varieties; in comparison, Sova and Filin had higher Fe and similar Zn levels. Consistent with these findings, Craine & DeHaan (2024) also reported higher Ca, Fe, P, and K contents in IWG relative to whole wheat flour.
Mineral ratios (Ca: Mg, Fe: Zn, and Zn: Cu) of Filin and Sova are presented in Table 2. In a balanced diet, in addition to absolute mineral levels, the balance among minerals is important, as imbalances can significantly affect mineral absorption and physiological functions (Biel et al., 2021; Rosanoff et al., 2016). For instance, high calcium intake may reduce magnesium absorption, making the Ca:Mg ratio a critical factor in nutritional planning (Fiorentini et al., 2021). Optimal health outcomes have been associated with a Ca:Mg ratio close to 2, while ratios below 1.7 or above 2.8 may be linked to adverse effects (DiNicolantonio et al., 2018; Durlach et al., 1989; Rosanoff et al., 2016). Ratios in the range of 2.0–2.5 have also been suggested to reduce cardiovascular risk in older adults with diabetes (Huang et al., 2014).
In the present study, Ca:Mg ratios of Sova and Filin were 0.80 and 0.99, respectively. These values are higher than those reported for wheat (0.5–0.7) by Ostrowska and Porębska (2017) but remain below the proposed optimal range (Costello et al., 2021; Huang et al., 2014). Similarly, Biel et al. (2021) reported much lower Ca:Mg ratios (0.08–0.11) across common, spelt, emmer, and einkorn wheat genotypes. Overall, the lower Ca:Mg ratios observed in IWG suggest a relatively higher magnesium contribution compared to calcium, which may support improved magnesium availability in human diets relative to traditional wheat varieties.
Research has shown that a Fe:Zn ratio of 1:1 in the diet causes a slight inhibition of Zn absorption, while as the ratio of Fe increases, absorption of Zn significantly reduces (Biel et al., 2021; Rietra et al., 2017; Whittaker, 1998). In the present study, Fe:Zn ratio of IWG varieties Sova and Filin was 1.86 and 1.79, respectively. This Fe:Zn ratio value that is greater than 1 was due to higher amount of Fe compared to Zn (Table 2). However, absorption of Zn will also be affected by the mineral composition of other foods in the diet which might balance the ratio of Fe and Zn.
Zn and Fe act as antagonists to Cu, and at high levels, Zn ions can inhibit the absorption of Cu ions (Biel et al., 2021; Rietra et al., 2017). Therefore, maintaining an appropriate Zn:Cu ratio is important to prevent copper deficiency. Ratios exceeding 18 have been associated with an increased risk of Cu deficiency (Maret & Sandstead, 2006). In the present study, Zn:Cu ratios were 5.65 and 5.61 for Sova and Filin, respectively (Table 2), indicating a well-balanced relationship between these minerals. Common wheat, as well as spelt, emmer, and einkorn wheat genotypes have been reported to have higher Zn:Cu (Biel et al., 2021).
Phenolic content and antioxidant capacity
The free, bound, and total phenolic contents of IWG and the antioxidant capacities of the free and bound fractions of IWG are reported in Table 3. Free, bound, and total phenolic contents of Sova were 206.6 mg GAE/100g d.b., 366.6 mg GAE/100g d.b., and 573.3 mg GAE/100g d.b., respectively. Corresponding values of Filin were 213.0 mg GAE/100g d.b., 267.2 mg GAE/100g d.b., and 480.2 mg GAE/100g d.b. In both Sova and Filin, the bound phenolic values were higher than the free phenolic values. While the free phenolic content of purple-grained Filin was higher than Sova, the bound and total phenolic -values of Sova were higher than those of Filin.
Table 3. Free, bound, and total phenolic contents and antioxidant activity of IWG samples.
| Sova | Filin | ||
|---|---|---|---|
| Phenolic contents (mg GAE/100 g d.b.) |
Free | 206.6 ± 0.8b | 213.0 ± 2.3a |
| Bound | 366.6 ± 1.4a | 267.2 ± 1.0b | |
| Total | 573.3 ± 2.2a | 480.2 ± 3.3b | |
| Antioxidant activity (DPPH) (%AA) |
Free | 47.5 ± 0.1b | 48.8 ± 0.4a |
| Bound | 47.6 ± 0.2b | 48.9 ± 0.8a | |
| Antioxidant activity (ABTS) (mg TE/100 g d.b.) |
Free | 65.8 ± 0.1a | 20.6 ± 1.1b |
| Bound | 69.2 ± 0.3a | 27.9 ± 1.0b | |
| Total | 135.1 ± 0.4a | 48.5 ± 2.0b | |
| Antioxidant activity (CUPRAC) (mg TE/100 g d.b.) |
Free | 128.7 ± 1.1a | 116.9 ± 0.8b |
| Bound | 222.1 ± 0.9a | 134.0 ± 0.3b | |
| Total | 350.7 ± 2.0a | 250.9 ± 1.1b |
Values followed by different letters in the same row are significantly different (p<0.05). d.b.: dry basis. *Total phenolic content: sum of the free and bound phenolic contents.
While there is no available literature on the TPC of IWG genotypes, the TPC of bread produced using Sova flour incorporation to common wheat flour has previously been investigated (Cetiner et al., 2023b). This previous study investigated the phenolic content and antioxidant capacity of breads made by substituting hard red winter wheat flour with the flour of IWG variety Sova at 15, 30, 45, and 60% levels (Cetiner et al., 2023b). When the amount of TPC in Sova in the current study and that in breads containing Sova in Cetiner et al. (2023b) are compared, the TPC values in breads were much lower. This finding was expected as the heat treatment during bread baking process would substantially degrade the heat sensitive phenolics (Blanch & Ruiz del Castillo, 2021). Nevertheless, substitution of common wheat flour with IWG flour still enhances the TPC of bread as shown by Cetiner et al. (2023b) who reported that the TPC of bread samples containing 60% IWG flour increased by approximately 55% compared to the -control bread.
DPPH antioxidant activity (%) of Sova and Filin was 47.5 and 48.8 in the free fraction and 47.6 and 48.9 in the bound fraction, respectively. The ABTS values of Sova and Filin were 65.8 and 20.6 mg TE/100 g d.b. in the free fraction and 69.2 and 27.9 mg TE/100 g d.b. in the bound fraction, respectively. The CUPRAC values were 128.7 and 116.9 mg TE/100 g d.b. in the free fraction and 222.1 and 134.0 mg TE/100 g d.b. in the bound fraction for Sova and Filin, respectively. The literature is not replete with studies investigating the antioxidant properties of IWG. Cetiner et al. (2023b) reported that compared to control bread made from common wheat flour, the antioxidant activities of bread made by substituting common wheat flour with IWG flour were significantly higher, indicating the higher antioxidant activity of IWG flour.
While DPPH values were comparable between free and bound fractions, the higher antioxidant activities observed in the bound fractions, particularly as determined by ABTS and CUPRAC assays, indicate that bound phenolic compounds make major contributions to the antioxidant capacity of the IWG grains studied. This finding is consistent with previous reports showing that alkaline hydrolysates of IWG exhibit higher antioxidant activity than freely extractable fractions, highlighting the dominant role of cell-wall–esterified phenolics such as hydroxycinnamic acids. Similar trends have been reported for other cereal species, where esterified phenolic acids, especially ferulic acid, are the main contributors to in vitro antioxidant activity once released from the cell wall matrix (Tyl and Ismail, 2019).
The individual phenolics and anthocyanins of IWG varieties
The individual phenolics (free and bound fractions) of IWG are presented in Table 4. The coefficient of determination values (R2) for the calibration curves in the linear range of the compounds were greater than 0.9900, which simply reflects the goodness of fit of the linear regression within the studied concentration range. Together with these, the limit of detection (LOD) and limit of quantification (LOQ) values were calculated for each phenolic compound and provided in Table S1. In addition, the chromatograms of the standards are provided in Figure S1. The results revealed that the LOQ values were low enough to detect and quantify even small amounts of phenolics present in the extracts.
Table 4. Free and bound phenolic compounds of IWG samples (μg/g dry basis).
| Phenolic compounds | Free extract | Bound extract | ||
|---|---|---|---|---|
| Sova | Filin | Sova | Filin | |
| Gallic acid | 44.33 ± 0.06a | 33.75 ± 0.05b | 12.11 ± 0.06c | 8.85 ± 0.06d |
| Protocatechuic acid | 13.19 ± 0.04b | 26.45 ± 0.03a | 5.25 ± 0.01c | n.d. |
| Ellagic acid | 6.74 ± 0.07d | 7.15 ± 0.06c | 17.83 ± 0.03b | 18.48 ± 0.06a |
| Caffeic acid | 6.09 ± 0.05b | 7.02 ± 0.03a | 7.06 ± 0.03a | n.d. |
| p-Coumaric acid | 1.57 ± 0.06d | 4.12 ± 0.03c | 12.14 ± 0.03a | 10.36 ± 0.05b |
| Ferulic acid | 10.37 ± 0.06d | 13.91 ± 0.01c | 31.64 ± 0.42a | 22.62 ± 0.03b |
| Myricetin | 34.81 ± 0.05b | 35.34 ± 0.07a | 34.82 ± 0.05b | n.d. |
| Quercetin | 16.87 ± 0.02b | 16.98 ± 0.09b | 17.37 ± 0.04a | n.d. |
| Kaempferol | 7.83 ± 0.03b | 10.47 ± 0.08a | 6.36 ± 0.01c | 6.34 ± 0.01c |
| Rutin | 7.31 ± 0.03d | 22.06 ± 0.05b | 28.41 ± 0.51a | 20.28 ± 0.00c |
| Chlorogenic acid | 9.58 ± 0.03b | 3.41 ± 0.03a | 2.13 ± 0.01c | n.d. |
Values followed by different letters in the same row are significantly different (p<0.05). Statistical analysis was performed for both free and bound forms of each phenolic compound.
n.d.: not detected.
Gallic acid, protocatechuic acid, ellagic acid, caffeic acid, p-coumaric acid, ferulic acid, myricetin, quercetin, kaempferol, rutin, and chlorogenic acid were detected in the IWG varieties. Ferulic acid was the predominant phenolic acid in the bound fraction of both Sova and Filin, which is consistent with previous reports for cereals and IWG, where ferulic acid is known to be largely esterified to cell wall polysaccharides (Boakye et al., 2023; Schendel et al., 2015; Tyl and Ismail, 2019).
Anthocyanin compounds were detected at low levels in Filin (purple), while none were detected in Sova (red), likely reflecting genotype-specific differences in anthocyanin biosynthesis. Filin exhibited a relatively light shade of purple color (Figure 1), which may explain its low anthocyanin content. As breeding efforts for colored IWG varieties are still emerging, further work is needed to develop lines with enhanced anthocyanin accumulation.
In Filin, the anthocyanins included delphinidin-3-O-β-D-glucoside chloride (0.42 μg/100 g d.b.), cyanidin 3-O-glucoside chloride (0.08 μg/100 g d.b.), cyanidin 3-O-rutinoside chloride (0.09 μg/100 g d.b.), pelargonidin-3-O-glucoside chloride (0.18 μg/100 g d.b.), peonidin 3-O-glucoside chloride (0.47 μg/100 g d.b.), and malvidin-3-O-glucoside chloride (4.58 μg/100 g d.b.). Among these, Malvidin-3-O-glucoside chloride was the most abundant anthocyanin compound in the free fraction (data not shown in the table). The detection of malvidin-3-O-glucoside chloride as the most abundant anthocyanin is notable because this compound has been associated with antioxidant properties, anti-inflammatory effects, and stability at neutral pH, and lower glycemic response—making it favorable for food formulations (Mueller et al., 2018).
In the literature, cyanidin was identified as the major aglycone, while peonidin was the second-highest aglycone in purple-colored wheat (Abdel-Aal et al., 2018). According to Sharma et al. (2020), purple wheat flour extracts displayed the highest concentration of cyanidin-3-O--glucoside chloride, followed by pelargonidin-3-O-glucoside chloride. Shamanin et al. (2024) analyzed various colored wheats (red, blue, black, and brown) and reported that the anthocyanin profiles in colored wheat varied based on genotype. They also indicated that malvidin-3-O--glucoside chloride and cyanidin-3-O-glucoside chloride were the more abundant anthocyanins. Similarly, Geyik et al. (2023) examined the bran of different colored wheats and concluded that cyanidin-3-O-glucoside chloride was the predominant anthocyanin in free extracts of purple wheat brans. Unlike most purple wheat varieties, where cyanidin derivatives (especially cyanidin-3-O-glucoside chloride) are reported as dominant (Geyik et al., 2023; Sharma et al., 2020), in Filin, the malvidin-3-O--glucoside chloride was the most abundant compound (4.58 μg/100 g d.b.).
The absence of detectable anthocyanins in both free and bound fractions of Sova confirms that its red pigmentation likely arises from catechin-tannin compounds, as previously suggested for red wheat (Garg et al., 2016), rather than from anthocyanins in the pericarp.
Carotenoid composition of IWG varieties
Carotenoids are pigments present in a variety of sources, including fruits, vegetables, plants, algae, and photosynthetic bacteria. Since humans cannot synthesize carotenoids, they must obtain them through diet or as supplements. Carotenoids have antioxidant properties, with β-carotene acting as pro-vitamin A and lutein/zeaxanthin supporting eye health by forming macular pigment (Eggersdorfer & Wyss, 2018). Lutein, zeaxanthin, and β-carotene contents of Sova and Filin samples are provided in Table 5. Lutein, zeaxanthin, and β-carotene contents of Sova were 4.4 μg/g, 0.5 μg/g, and 1.0 μg/g, respectively, while corresponding values for Filin were 4.0 μg/g, 0.8 μg/g, and 11.7 μg/g. Tyl & Ismail (2019) also reported the two main carotenoids in IWG as lutein and zeaxanthin. Paznocht et al. (2019) analyzed the lutein, zeaxanthin, and β-carotene contents of red- and purple-colored wheats and reported that their respective contents were in the range of 0.312–0.870 μg/g, 0.039–0.110 μg/g, and n.d.–0.084 μg/g, respectively. Sova and Filin had much higher lutein, zeaxanthin, and β-carotene contents than those of colored common wheat genotypes reported by Paznocht et al. (2019).
Table 5. Carotenoid composition of IWG samples.
| Lutein (μg/g) | Zeaxanthin (μg/g) | ß-carotene (μg/g) | |
|---|---|---|---|
| Sova | 4.4 ± 0.12a | 0.5 ± 0.06b | 1.0 ± 0.01b |
| Filin | 4.0 ± 0.21a | 0.8 ± 0.08a | 11.7 ± 2.28a |
Values followed by different letters in the same column are significantly different (p<0.05).
Further studies incorporating additional IWG genotypes, biological replication, and complementary analytical validation are warranted to confirm the carotenoid rich nature of IWG and to clarify their nutritional relevance. Given the lipophilic nature of carotenoids and the polarity of the extraction solvents used, the antioxidant capacity measured in this study predominantly reflects phenolic compounds rather than carotenoids.
Conclusion
This study provides valuable insights into the functional properties and nutritional composition of IWG varieties, Sova (red) and Filin (purple). Both varieties exhibited high protein content, significant mineral concentrations, and a more balanced Zn:Cu ratio compared to common wheat, supporting their potential role in a nutritionally balanced diet. Incorporating IWG into food products could contribute to improving mineral intake in populations vulnerable to mineral deficiencies. IWG is a rich source of carotenoids, including lutein, zeaxanthin, and β-carotene, which may complement the antioxidant activity primarily driven by phenolic compounds. IWG’s higher phenolic content and antioxidant activity compared to common wheat highlight its potential health benefits. These findings suggest that IWG could serve as a promising functional ingredient in the food industry, offering both nutritional and bioactive advantages. However, the differences between Sova and Filin with different grain colors should be viewed as preliminary; future studies should expand to include additional genotypes and true biological replications across environments to enable broader inference and greater statistical power. Further studies are needed to include more IWG varieties with multiyear and multilocation biological replication using common wheat as a standardized reference material to enable more robust and comprehensive comparative assessments. While our in vitro compositional and antioxidant findings provide foundational evidence for IWG’s nutritional potential, they do not establish health effects; confirming bioaccessibility, bioavailability, and metabolic relevance in vivo will be the focus of future work.
Authors Contribution
All authors contributed equally to this article.
Mandatory Disclosure on the Use of Artificial Intelligence
The authors affirm that no generative AI tools were used for the creation of scientific content, data analysis, or interpretation in this manuscript. Only standard editorial tools (e.g., spelling and grammar checks) were applied to improve readability.
Data Availability Statement
The data presented in this study are available on request from the corresponding author.
Conflicts of Interest
The authors declare that they have no conflicts of interest.
Funding
This research was supported by the Russian Science Foundation (agreement No. 25-16-20042 dated 17 April 2025).
REFERENCES
AACC, International. 2010. The American Association of Cereal Chemists Approved Methods of Analysis 10th ed. The Association, St. Paul, MN., USA.
Abdel-Aal, E.S.M., Hucl, P., and Rabalski, I. 2018. Compositional and antioxidant properties of anthocyanin-rich products prepared from purple wheat. Food Chemistry 254: 13–19. 10.1016/j.foodchem.2018.01.170
Agilent ICP-MS (7850/7800/7900) MassHunter Workstation User Guide. 2022. Agilent Technologies, Inc. USA.
Ajdarov, A.N., Shepelev, S.S., and Shamanin, V.P. 2021. Characteristics of high-stemmed and low-stemmed plants by the components of productivity isolated from the population of large-grain wheatgrass of the gray variety Sova in the conditions of the southern forest-steppe of the Western Siberia. Bulletin of Omsk State Agrarian University 3: 5–16.
ASTM, E 1164. 2002. American Society for Testing and Materials. Standard Practice for Obtaining Spectrophotometric Data for Object-Color Evaluation (No. ASTM E 1164). West Conshohocken, Pennsylvania, USA.
Banjade, J.D., Gajadeera, C., Tyl, C.E., Ismail, B.P., and Schoenfuss, T.C. 2019. Evaluation of dough conditioners and bran refinement on functional properties of intermediate wheatgrass (Thinopyrum intermedium). Journal of Cereal Science. 86: 26–32. 10.1016/j.jcs.2019.01.001
Becker, R., Wagoner, P., Hanners, G.D., and Saunders, R.M. 1991. Compositional, nutritional and functional evaluation of Intermediate Wheatgrass (Thinopyrum Intermedium). Journal of Food Processing and Preservation 15(1): 63–77. 10.1111/j.1745-4549.1991.tb00154.x
Bharathi, R., Muljadi, T., Tyl, C., and Annor, G.A. 2022. Progress on breeding and food processing efforts to improve chemical composition and functionality of intermediate wheatgrass (Thinopyrum intermedium) for the food industry. Cereal Chemistry 99(2): 235–252. 10.1002/cche.10482
Biel, W., Jaroszewska, A., Stankowski, S., Sobolewska, M., and Kępińska-Pacelik, J. 2021. Comparison of yield, chemical composition and farinograph properties of common and ancient wheat grains. European Food Research and Technology. 247(6): 1525–1538. 10.1007/s00217-021-03729-7
Blanch, G.P., and Ruiz del Castillo, M.L. 2021. Effect of baking temperature on the phenolic content and antioxidant activity of black corn (Zea mays L.) bread. Foods 10(6): 1202.
Boakye, P.G., Okyere, A.Y., and Annor, G.A. 2023. Impact of extrusion processing on the nutritional and physicochemical properties of intermediate wheatgrass (Thinopyrum intermedium). Cereal Chemistry 100(3): 628–642. 10.1002/cche.10632
Brett, C.T., and Waldron, K.W., 1996. Physiology and Biochemistry of Plant Cell Walls. Chapman and Hall, London.
Cetiner, B., Koksel, F., Morgounov, A.I., and Koksel, H. 2025. Intermediate wheatgrass (Thinopyrum intermedium): An innovative and sustainable ingredient in cereal-based foods, In: Next-generation Cereal-based Foods and Beverages: Breakthroughs in Technology, Sustainability and Health. Editors: Cristina, M. Rosell and Filiz Koksel. Elsevier
Cetiner, B., Ozdemir, B., Yazar, S., and Koksel, H. 2023a. Comparison of mineral concentration and bioavailability of various modern and old bread wheat varieties grown in Anatolia in around one century. European Food Research. 249(3): 587–596. 10.1007/s00217-022-04153-1
Cetiner, B., Shamanin, V.P., Tekin-Cakmak, Z.H., Pototskaya, I.V., Koksel, F., Shepelev, S.S., Aydarov, A.N., Ozdemir, B., Morgounov, A.I., and Koksel, H. 2023b. Utilization of intermediate wheatgrass (Thinopyrum intermedium) as an innovative ingredient in bread making. Foods 12(11): 2109. 10.3390/foods12112109
Cetiner, B., Tömösközi, S., Török, K., Salantur, A., and Koksel, H. 2020. Comparison of the arabinoxylan composition and physical properties of old and modern bread wheat (Triticum aestivum L.) and landraces genotypes. Cereal Chemistry 97(2): 505–514. 10.1002/cche.10265
Costello, R.B., Rosanoff, A., Dai, Q., Saldanha, L.G., and Potischman, N.A., 2021. Perspective: Characterization of dietary supplements containing calcium and magnesium and their respective ratio—is a rising ratio a cause for concern? Advances in Nutrition 12(2): 291–297. 10.1093/advances/nmaa160
Craine, E.B., and DeHaan, L.R. 2024. Nutritional quality of-early-generation Kernza perennial grain. Agriculture 14(6): 919. 10.3390/agriculture14060919
Crews, T.E., and Cattani, D.J. 2018. Strategies, advances, and-challenges in breeding perennial grain crops. Sustainability 10(7): 2192. 10.3390/su10072192
Cui, L., Ren, Y., Murray, T.D., Yan, W., Guo, Q., Niu, Y., Sun, Y., and Li, H. 2018. Development of perennial wheat through hybridization between wheat and wheatgrasses: A review. Engineering 4(4): 507–513. 10.1016/j.eng.2018.07.003
Dangi, P., Chaudhary, N., Paul, A., Sharma, A., Dutta, I., and Razdan, R. 2023. Pigmented wheat: Nutrition scenario and health benefits. In “Pigmented Cereals and Millets”. S.P. Bangar, S. Maqsood and A.K. Siroha (Ed.), p. 1–26. The Royal Society of Chemistry. 10.1039/9781837670291-00001
DeHaan, L.R., Anderson, J.A., Bajgain, P., Basche, A., Cattani, D.J., Crain, J., Crews, T.E., David, C., Duchene, O., and Gutknecht, J. 2023. Discussion: Prioritize perennial grain development for sustainable food production and environmental benefits. Science of the Total Environment 895: 164975. 10.1016/j.scitotenv.2023.164975
DeLuccia, R., Cheung, M., Ng, T., Ramadoss, R., Altasan, A., and Sukumar, D. 2019. Calcium to magnesium ratio higher than optimal across age groups (P10-100-19). Current Developments in Nutrition 3: Suppl 1. 10.1093/cdn/nzz034.P10-100-19
Del Coco, L., Laddomada, B., Migoni, D., Mita, G., Simeone, R., and Fanizzi, F. 2019. Variability and site dependence of grain mineral contents in tetraploid wheats. Sustainability 11:736. 10.3390/su11030736
DiNicolantonio, J.J., O’Keefe, J.H., and Wilson, W. 2018. Subclinical magnesium deficiency: A principal driver of cardiovascular disease and a public health crisis. Open Heart. 5: e000668.
Durlach, J. 1989. Recommended dietary amounts of magnesium: Mg RDA. Magnesium Research 2:195–203.
Eggersdorfer, M., and Wyss, A. 2018. Carotenoids in human nutrition and health. Archives of Biochemistry and Biophysics 652: 18–26. 10.1016/j.abb.2018.06.001
Ferguson, M., Valsalan, A., Cattani, D., and Malalgoda, M. 2024. Evaluating the quality characteristics of intermediate wheatgrass grown in the Canadian prairies. Cereal Chemistry 101(6): 1246–1260. 10.1002/cche.10823
Fiorentini, D., Cappadone, C., Farruggia, G., and Prata, C. 2021. Magnesium: biochemistry, nutrition, detection, and social impact of diseases linked to its deficiency. Nutrients 13(4):1136. 10.3390/nu13041136
Garg, M., Chawla, M., Chunduri, V., Kumar, R., Sharma, S., Sharma, N.K., Kaur, N., Kumar, A., Mundey, J.K., Saini, M.K., and Singh, S.P. 2016. Transfer of grain colors to elite wheat cultivars and their characterization. Journal of Cereal Science 71: 138–144. 10.1016/j.jcs.2016.08.004
Gazza, L., Galassi, E., Ciccoritti, R., Cacciatori, P., and Pogna, N.E. 2016. Qualitative traits of perennial wheat lines derived from different Thinopyrum species. Genetic Resources and Crop Evolution 63(2): 209–219. 10.1007/s10722-015-0240-8
Geyik, Ö.G., Tekin-Cakmak, Z.H., Shamanin, V.P., Karasu, S., Pototskaya, I.V., Shepelev, S.S., Chursin, A.S., Morgounov, A.I., Yaman, M., Sagdic, O., and Koksel, H. 2023. Effects of phenolic compounds of colored wheats on colorectal cancer cell lines. Quality Assurance and Safety of Crops & Foods. 15(4): 21–31. 10.15586/qas.v15i4.1354
Huang, J.H., Tsai, L.C., Chang, YC., and Cheng, F.C. 2014. High or low calcium intake increases cardiovascular disease risks in older patients with type 2 diabetes. Cardiovascular Diabetology 13(1): 120.
Hussain, A., Larsson, H., Kuktaite, R., and Johansson, E. 2010. Mineral composition of organically grown wheat genotypes: Contribution to daily minerals intake. The International Journal of Environmental Research and Public Health 7(9): 3442–3456. 10.3390/ijerph7093442
ISO, 520. 2010. Cereals and pulses—Determination of the mass of 1000 grains.
Lempereur, I., Rouau, X., and Abecassis, J. 1997. Genetic and agronomic variation in arabinoxylan and ferulic acid contents of Durum wheat (Triticum durum L.) grain and its milling fractions. Journal of Cereal Science 25:103–110. 10.1006/jcrs.1996.0090
Lequart, C., Nuzillard, J.M., Kurek, B., and Debeire, P. 1999. Hydrolysis of wheat bran and straw by an endoxylanase: production and structural characterization of cinnamoyl--oligosaccharides. Carbohydrate Research 319:102–111. 10.1016/S0008-6215(99)00110-X
Li, L., Shewry, P.R., and Ward, J.L. 2008. Phenolic acids in wheat varieties in the HEALTHGRAIN diversity screen. Journal of Agricultural and Food Chemistry 56(21): 9732–9739. 10.1021/jf801069s
Maret, W., and Sandstead, H.H. 2006. Zinc requirements and the risks and benefits of zinc supplementation. Journal of Trace Elements in Medicine and Biology 20(1): 3–18. 10.1016/j.jtemb.2006.01.006
Marti, A., Bock, J.E., Pagani, M.A., Ismail, B., and Seetharaman, K. 2016. Structural characterization of proteins in wheat flour doughs enriched with intermediate wheatgrass (Thinopyrum intermedium) flour. Food Chemistry 194: 994–1002. 10.1016/j.foodchem.2015.08.082
Marti, A., Qiu, X., Schoenfuss, T.C., and Seetharaman, K. 2015. Characteristics of perennial wheatgrass (Thinopyrum intermedium) and refined wheat flour blends: Impact on-rheological properties. Cereal Chemistry 92(5): 434–440. 10.1094/CCHEM-01-15-0017-R
Martínez-Ballesta, M.C., Dominguez-Perles, R., Moreno, D.A., Muries, B., Alcaraz-López, C., Bastías, E., García-Viguera, C., and Carvajal, M. 2010. Minerals in plant food: Effect of agricultural practices and role in human health. A review. Agronomy for Sustainable Development 30(2): 295–309. 10.1051/agro/2009022
Mueller, D., Jung, K., Winter, M., Rogoll, D., Melcher, R., Kulozik, U., Schwarz, K., and Richling, E. 2018. Encapsulation of anthocyanins from bilberries–effects on bioavailability and intestinal accessibility in humans. Food Chemistry 248: 217–224. 10.1016/j.foodchem.2017.12.058
Naczk, M., and Shahidi, F. 2004. Extraction and analysis of-phenolics in food. Journal of Chromatography A 1054(1–2): 95–111. 10.1016/S0021-9673(04)01409-8
Nemli, E., Ozakdogan, S., Tomas, M., McClements, D.J., and Capanoglu, E. 2021. Increasing the bioaccessibility of antioxidants in tomato pomace using excipient emulsions. Food Biophysics 16(3): 355–364. 10.1007/s11483-021-09674-y
Oliveira, W.S., Chen, Q., Edleman, D., Annor, G.A., and Dias, F.F.G. 2024. Unraveling the impacts of germination on the volatile and fatty acid profile of Intermediate Wheatgrass (Thinopyrum intermedium) seeds. Molecules 29(17): 4268. 10.3390/molecules29174268
Ostrowska, A., and Porębska, G. 2017. The content of calcium and magnesium and the Ca:Mg ratio in cultivated plants in the context of human and animal demand for nutrients. Journal of Elementology 22(3): 995–1004. 10.5601/jelem.2016.21.4.1246
Padhy, A.K., Kaur, P., Singh, S., Kashyap, L., and Sharma, A. 2024. Colored wheat and derived products: Key to global nutritional security. Critical Reviews in Food Science and Nutrition 64(7): 1894–1910. 10.1080/10408398.2022.2119366
Parker, M.L., Ng, A., and Waldron, K.W. 2005. The phenolic acid and polysaccharide composition of cell walls of bran layers of mature wheat (Triticum aestivum L. cv. Avalon) grains. Journal of the Science of Food and Agriculture 85(15): 2539–2547. 10.1002/jsfa.2304
Paznocht, L., Kotíková, Z., Orsák, M., Lachman, J., and Martinek, P. 2019. Carotenoid changes of colored-grain wheat flours during bun-making. Food Chemistry 277: 725–734. 10.1016/j.foodchem.2018.11.019
Pimentel, D., Cerasale, D., Stanley, R.C., Perlman, R., Newman, E.M., Brent, L.C., Mullan, A., and Chang, D.T.I. 2012. Annual vs. perennial grain production. Agriculture, Ecosystems & Environment 161: 1–9. 10.1016/j.agee.2012.05.025
Pototskaya, I.V., Shamanin, V.P., Aydarov, A.N., and Morgounov, A.I. 2022. The use of wheatgrass (Thinopyrum intermedium) in breeding. Vavilovskii Zhurnal Genet Selektsii 26(5): 413–421. 10.18699/VJGB-22-51
Quintaes, K.D., and Diez-Garcia, R.W. 2015. The importance of-minerals in the human diet. In “Handbook of Mineral Elements in Food”. M. De La, Guardia and S. Garrigues (Ed.), 1st ed., p. 1–21. Wiley. 10.1002/9781118654316.ch1
Rahardjo, C.P., Gajadeera, C.S., Simsek, S., Annor, G., Schoenfuss, T.C., Marti, A., and Ismail, B.P. 2018. Chemical characterization, functionality, and baking quality of intermediate wheatgrass (Thinopyrum intermedium). Journal of Cereal Science 83: 266–274. 10.1016/j.jcs.2018.09.002
Rietra, R.P.J.J., Heinen, M., Dimkpa C.O., and Bindraban, P.S. 2017. Effects of nutrient antagonism and synergism on yield and fertilizer use efficiency. Communications in Soil Science and Plant Analysis48(16): 1895–1920. 10.1080/00103624.2017.1407429
Rosanoff, A., Dai, Q., and Shapses, S.A. 2016. Essential nutrient interactions: Does low or suboptimal magnesium status interact with vitamin D and/or calcium status? Advances in Nutrition 7(1): 25–43. 10.3945/an.115.008631
Schendel, R.R., Becker, A., Tyl, C.E., and Bunzel, M. 2015. Isolation and characterization of feruloylated arabinoxylan oligosaccharides from the perennial cereal grain intermediate wheat grass (Thinopyrum intermedium). Carbohydrate Research 407: 16–25. 10.1016/j.carres.2015.01.006
Shamanin, V.P., Morgounov, A.I., Aydarov, A.N., Shepelev, S.S., Chursin, A.S., Pototskaya, I.V., Khamova, O.F., and DeHaan, L.R. 2021. Large-grained wheatgrass variety Sova (Thinopyrum intermedium) as an alternative to perennial wheat. Sel’skokhozyaistvennaya Biologiya 56(3): 450–464.
Shamanin, V.P., Tekin-Cakmak, Z.H., Gordeeva, E.I., Karasu, S., Pototskaya, I., Chursin, A.S., Pozherukova, V.E., Ozulku, G., Morgounov, A.I., Sagdic, O., and Koksel, H. 2022. Antioxidant capacity and profiles of phenolic acids in various genotypes of purple wheat. Foods 11(16): 2515. 10.3390/foods11162515
Shamanin, V.P., Tekin-Cakmak, Z.H., Karasu, S., Pototskaya, I.V., Gordeeva, E.I.O., Verner, A., Morgounov, A.I., Yaman, M., Sagdic, O., and Koksel, H. 2024. Antioxidant activity,-anthocyanin profile, and mineral compositions of colored wheats. Quality Assurance and Safety of Crops & Foods 16(1): 98–107. 10.15586/qas.v16i1.1414
Shamanin, V.P., Tekin-Cakmak, Z.H., Karasu, S., Pototskaya, I.V., Shepelev, S.S., Chursin, A.S., Morgounov, A.I., Sagdic, O., and Koksel, H. 2023. Phenolic content and antioxidant capacity of synthetic hexaploid wheats. Plants 12(12): 2301. 10.3390/plants12122301
Sharma, N., Tiwari, V., Vats, S., Kumari, A., Chunduri, V., Kaur, S., Kapoor, P., and Garg, M. 2020. Evaluation of anthocyanin content, antioxidant potential and antimicrobial activity of black, purple and blue colored wheat flour and wheat-grass juice against common human pathogens. Molecules 25(24): 5785. 10.3390/molecules25245785
Tang, F.H.M., Crews, T.E., Brunsell, N.A., and Vico, G. 2024. Perennial intermediate wheatgrass accumulates more soil organic carbon than annual winter wheat—a model assessment. Plant Soil 494(1–2): 509–528. 10.1007/s11104-023-06298-8
Taylor, K., Samaddar, S., Schmidt, R., Lundy, M., and Scow, K. 2023. Soil carbon storage and compositional responses of soil microbial communities under perennial grain IWG vs. annual wheat. Soil Biology and Biochemistry. 184: 109111. 10.1016/j.soilbio.2023.109111
Tyl, C., and Ismail, B.P. 2019. Compositional evaluation of perennial wheatgrass (Thinopyrum intermedium) breeding populations. International Journal of Food Science & Technology 54(3): 660–669. 10.1111/ijfs.13925
Whittaker, P. 1998. Iron and zinc interactions in humans. The American Journal of Clinical Nutrition 68(2): 442S–446S. 10.1093/ajcn/68.2.442S
Zhang, X., Ohm, J.B., Haring, S., DeHaan, L.R., and Anderson, J.A. 2015. Towards the understanding of end-use quality in intermediate wheatgrass (Thinopyrum intermedium): High-molecular-weight glutenin subunits, protein polymerization, and mixing characteristics. Journal of Cereal Science66: 81–88. 10.1016/j.jcs.2015.10.008
Zhao, F.J., Su, Y.H., Dunham, S.J., Rakszegi, M., Bedo, Z., McGrath, S.P., and Shewry, P.R. 2009. Variation in mineral micronutrient concentrations in grain of wheat lines of diverse origin. Journal of Cereal Science 49(2): 290–295. 10.1016/j.jcs.2008.11.007
Supplementary
Figure S1. Chromatograms of the phenolic compounds in their respective retention time (RT) at 278 nm (A) and 320 nm (B). 1: gallic acid (RT: 5.6 min); 2: protocatechuic acid (RT: 9.74 min); 3: chlorogenic (RT: 12.29); 4: caffeic acid (RT: 15.26 min); 5: ellagic acid (RT: 20.6 min); 6: quercetin (RT: 31.41) 7: p-coumaric acid (RT: 19.82); 8: rutin (RT: 19.84 min); 9: ferulic acid (RT: 22.05); 10: myricetin (RT: 26.10 min); and 11: kaempferol (RT: 36.12 min).
Figure S2. Chromatograms of the anthocyanins in their respective retention time (RT) at 520 nm. 1: cyanidin chloride (RT: 12.9 min); 2: delphinidin-3-O-ß-D-glucoside chloride (RT: 14.0 min); 3: cyanidin 3-O-glucoside chloride (RT: 15.8 min); 4: cyanidin 3 rutinoside (RT: 16.3 min); 5: pelargonidin 3-O-glucoside chloride (RT: 17.8 min); 6: peonidin 3-O-glucoside chloride (RT: 18.9 min); 7: malvidin-3-O-glucoside chloride (RT: 19.8 min).
Figure S3. Chromatograms of the carotenoids in their respective retention time (RT) at 475 nm. Lutein (RT: 3–4 min); -Zeaxanthin (RT: 4–5 min); and Beta carotene (RT: 12–13 min).
Figure S4. Calibration curves of the carotenoid standards.
Table S1. Calibration, linearity, calibration equation, and LOD and LOQ values of the HPLC method for analysis of the phenolic standards.
| Phenolic compounds | Linear range (mg/L) | Calibration equation | R2 | LOD (mg/L) | LOQ (mg/L) |
|---|---|---|---|---|---|
| Gallic acid | 0.40–210 | y = 47420x − 84379 | 0.9994 | 2.561 | 7.457 |
| Protocatechuic acid | 0.40–200 | y = 18267x – 4163.7 | 0.9999 | 1.960 | 5.939 |
| Ellagic acid | 0.20–100 | y = 17267x − 20278 | 0.9900 | 2.085 | 6.319 |
| Caffeic acid | 0.30–160 | y = 116686x − 117361 | 0.9998 | 1.684 | 5.104 |
| p-Coumaric acid | 0.30–160 | y = 144056x – 9120.3 | 0.9999 | 0.169 | 0.511 |
| Ferulic acid | 0.30–160 | y = 112838x − 40248 | 0.9999 | 1.645 | 4.984 |
| Myricetin | 0.65–330 | y = 107340x − 845083 | 0.9930 | 3.001 | 9.095 |
| Quercetin | 0.65–330 | y = 100818x − 405052 | 0.9978 | 2.250 | 6.820 |
| Kaempferol | 0.65–330 | y = 90037x − 138396 | 0.9995 | 2.113 | 6.404 |
| Rutin | 1.00–100 | y = 24918x + 1645.5 | 0.9999 | 0.161 | 0.488 |
| Chlorogenic acid | 1.00–100 | y = 39943x – 6958.2 | 0.9999 | 0.165 | 0.499 |
Table S2. Accuracy and precision of the ICP-MS method.
| Element | Concentration (ppm) | Recovery (%) | RSD (%) |
|---|---|---|---|
| Mg | 5000–50000 | 99.3–111.6 | 0.14–1.19 |
| Ca | 5000–50000 | 99.1–111.3 | 0.36–0.91 |
| Mn | 500–10000 | 99.4–113.5 | 0.09–0.39 |
| Fe | 500–10000 | 99.4–110.1 | 0.09–0.80 |
| Cu | 500–10000 | 98.7–115.8 | 0.21–0.92 |
| Zn | 500–10000 | 98.6–119.1 | 0.21–0.88 |
RSD: Relative standard deviation.